
Overview
In this blog post, we’ll explore the process of setting up centralized monitoring for Amazon EKS clusters using Prometheus and Grafana. We’ll delve into the challenges encountered when monitoring multiple EKS clusters and discuss how a centralized solution can streamline operations and enhance visibility. Additionally, we’ll provide a detailed summary of the solution, including step-by-step instructions and the salient features of our approach.
Challenges in Implementing a Monitoring System for EKS
-
Complexity: EKS clusters are intricate, making monitoring challenging.
-
Scalability: Ensuring monitoring scales with cluster growth is crucial.
-
Visibility: Managing multiple clusters requires centralized monitoring.
-
Resource Management: Monitoring tools can strain resources if not managed efficiently.
-
Data Aggregation: Collecting metrics from diverse sources requires careful setup.
-
Security: Balancing access with security standards is crucial.
-
Alerting Efficiency: Effective alerting systems need careful configuration for prompt response.
### Summary of the Solution
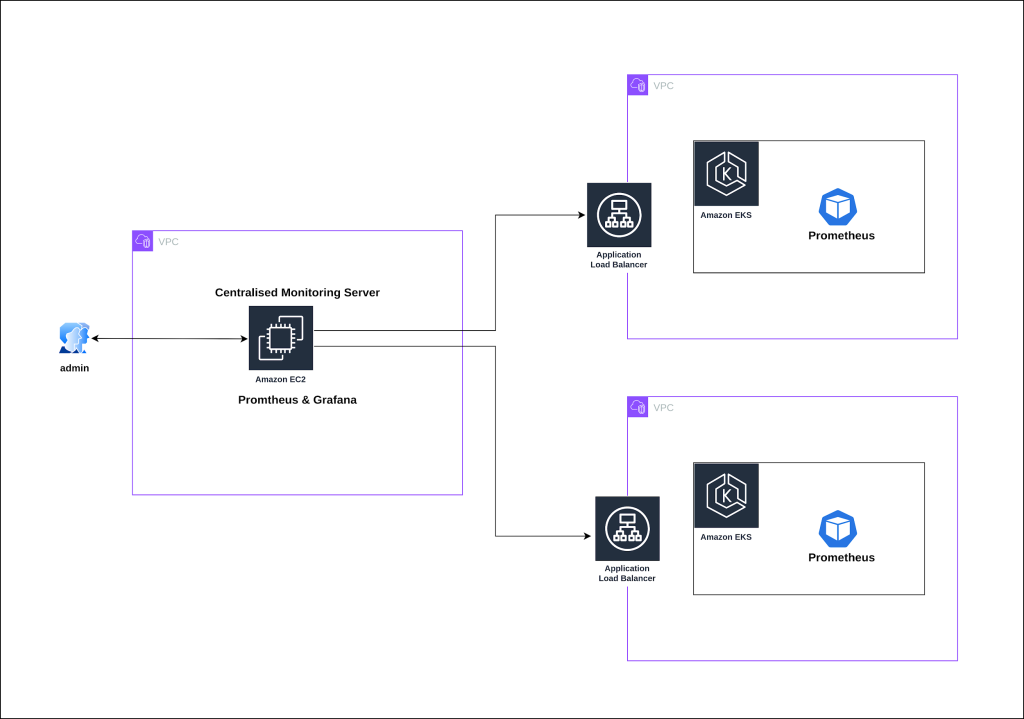
Our solution involves setting up centralized monitoring for EKS infrastructure using Prometheus and Grafana. We deploy Prometheus and Grafana on a centralized EC2 server, ensuring efficient resource utilization. Additionally, we configure Prometheus to scrape metrics from EKS cluster ALB targets, enabling centralized monitoring. Grafana dashboards are customized to provide comprehensive insights into the health and performance of multiple EKS clusters. This setup facilitates efficient management, uniform monitoring configurations, and informed decision-making, ultimately enhancing visibility and aiding in proactive maintenance.
The high-level architecture diagram illustrates the components involved in our centralized monitoring setup.
Prerequites
-
Familiarity with Prometheus and Grafana
-
Understanding of EKS
-
Basic knowledge of AWS Cloud
-
Comfortable working with YAML files
Implementation Steps
To establish a centralized monitoring system for EKS using Prometheus and Grafana. Our approach involves creating an AWS EC2 instance where we’ll install Prometheus and Grafana packages. Additionally, we’ll leverage the Prometheus community Helm chart to deploy essential components such as Prometheus-server, kube-state-metrics, and node-exporter on each Amazon EKS cluster to collect metrics.
Add repo to local helmhelm repo add prometheus-community https://prometheus-community.github.io/helm-charts# Update repohelm repo update# Install the prometheus server and other required componentshelm install prometheus prometheus-community/prometheus# Verify the components.kubectl get deployment,service,daemonset -n prometheus
4. Exposing Metrics via AWS Elastic Load BalancerExpose the metrics collected by Prometheus deployment from each EKS cluster via an AWS Elastic Load Balancer (ALB). You can choose between internal or internet-facing ALBs based on your requirements.
Expose the service/Prometheus-server via an AWS Load Balancer, utilizing either a kubernetes Ingress or a Service-type Load Balancer.
- Modify the prometheus.yml file on the Centralized server to incorporate the targets of the EKS cluster ALB. (See prometheus.yml for guidance.)
– job_name: federate honor_labels: true honor_timestamps: true params: match: – ‘{job=”prometheus”}’ – ‘{job=”kubernetes-apiservers”}’ – ‘{job=”kubernetes-nodes”}’ – ‘{job=”kubernetes-nodes-cadvisor”}’ – ‘{job=”kubernetes-service-endpoints”}’ – ‘{job=”kubernetes-service-endpoints-slow”}’ – ‘{job=”prometheus-pushgateway”}’ – ‘{job=”kubernetes-services”}’ – ‘{job=”kubernetes-pods”}’ – ‘{job=”kubernetes-pods-slow”}’ – ‘{name=~”job:.*”}’ scrape_interval: 5s scrape_timeout: 5s metrics_path: /federate scheme: https # Depends on target endpoint http or https follow_redirects: true enable_http2: true static_configs: – targets: – prometheus.dev-eks.com # ALB DNS mapped domain for dev EKS cluster labels: cluster: dev-eks-cluster # Linked to Dashboards, Value should be exact name of Kubernetes cluster environment: dev # Linked to alerts. Do not change or do the respective change in alerts_files – targets: – prometheus.prod-eks.com # ALB DNS mapped domain for prod EKS cluster labels: cluster: prod-eks-cluster # Linked to Dashboards, Value should be exact name of Kubernetes cluster environment: prod # Linked to alerts. Do not change or do the respective change in alerts_files
- Ensuring the Smooth Operation of Your Centralized Kubernetes Monitoring Setup
-
Open the Prometheus console in a web browser using its URL (e.g., http://:9090) and grafana on http://:3000).
-
Check Prometheus targets in the Prometheus console to ensure they’re “UP”.
-
Explore Prometheus metrics to confirm collection from EKS clusters.
-
Verify Grafana dashboards display relevant metrics for multiple EKS clusters.
- Additional improvements:
-
Configure Prometheus to use InfluxDB as a persistent storage backend.
-
Set up notification channels for alerting using prometheus alertmanager.
-
Utilize InfluxDB with prometheus for persistent storage with regular backups to mitigate downtime and data loss.
-
Implement custom UI authentication for prometheus on centralized monitoring server.
-
You can utilize the centralized monitoring server to monitor additional servers and APIs(using blackbox exporter).
I have developed custom Grafana dashboards designed to monitor multiple EKS clusters from a single interface. To incorporate these dashboards into your Grafana setup, import these dashboards in Grafana by copy-pasting JSON directly.
Salient Features of Our Solution
Our solution offers several key features to address the challenges of monitoring multiple EKS clusters:
-
Efficiency: Centralized monitoring simplifies management tasks and ensures uniform configurations.
-
Comprehensive Insights: Aggregated metrics provide a holistic view of infrastructure health.
-
Unified Alerting: Consistent alerting rules facilitate prompt incident response.
-
Cost Management: Optimization of resource usage minimizes costs while maintaining performance.
Benefits
Centralized monitoring using Prometheus and Grafana offers numerous benefits for Kubernetes infrastructure management:
-
Efficiency: Manage multiple EKS clusters from one interface.
-
Consistency: Maintain uniform monitoring configurations and visualization standards across clusters.
-
Optimization: Identify usage patterns for resource optimization.
-
Unified Alerting: Prompt incident response and proactive maintenance with unified alerting.
-
Historical Analysis: Analyze performance data for informed decision-making.
-
Cost Management: Optimize resource usage and minimize unnecessary expenditures.
-
Compared to traditional methods, Prometheus and Grafana offer scalability, flexibility, real-time visibility, Kubernetes integration, community support, and cost-effectiveness.
Conclusion
In conclusion, implementing centralized monitoring for Amazon EKS clusters using Prometheus and Grafana is crucial for enhancing visibility, simplifying management, and optimizing resource usage. By following the steps outlined in this blog post, you can streamline your EKS monitoring workflow and ensure the health and performance of your infrastructure.
Written by Aafaq Rashid